Event Legend
Tracks
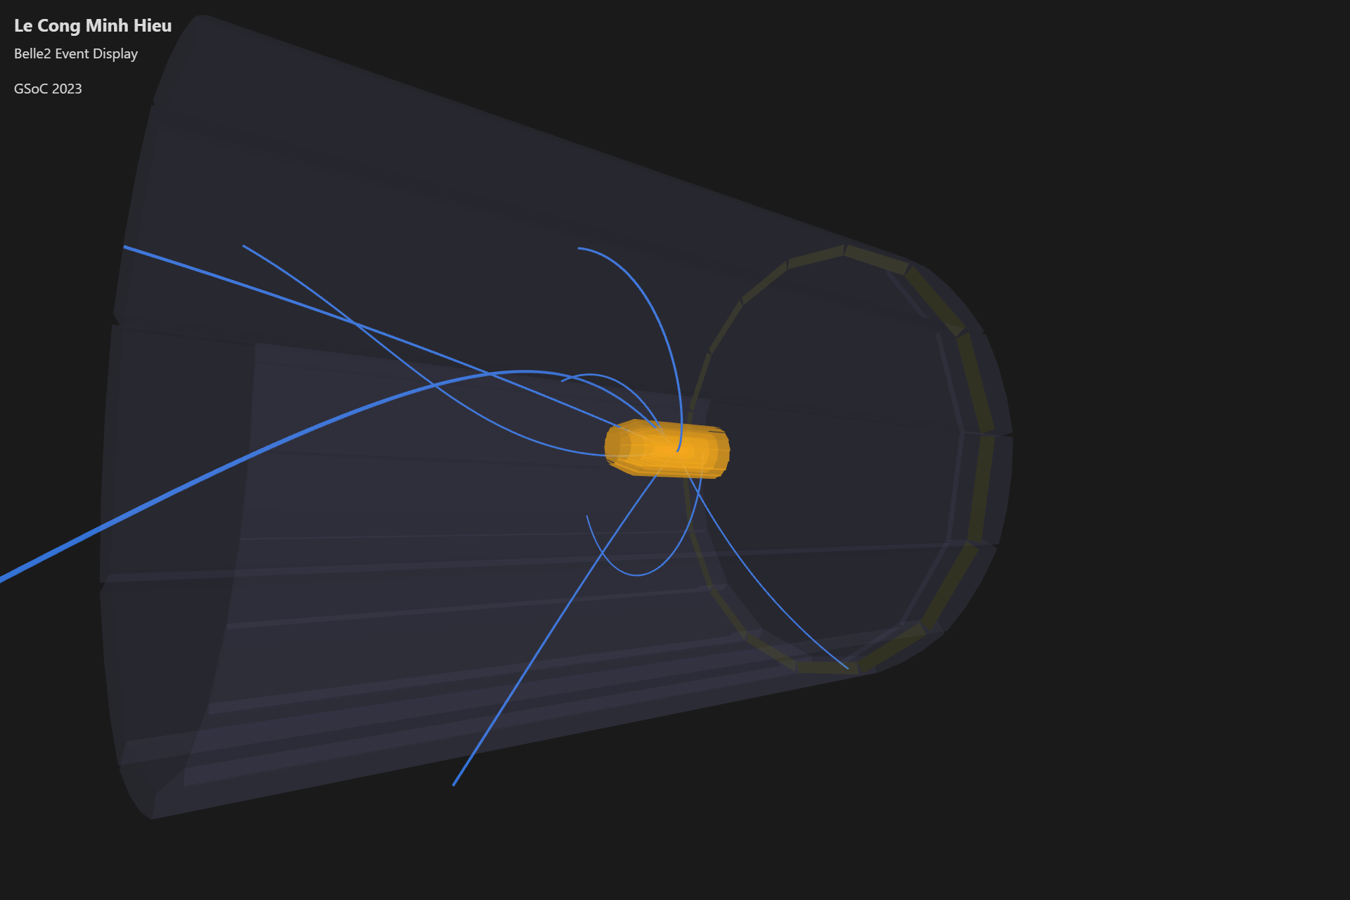
Fig 1. Tracks
Conventionally, the tracks are represented as continuous lines with the color blue (#336FD1). When zooming in to the size of the SVD, the track lines will become thinner to avoid overlap among them.
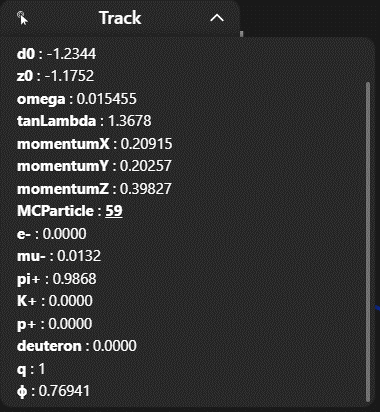
Fig 2. Track Information
The displayed track information includes helix parameters, momentums, charge, and probabilities for PIDLikelihoods. Additionally, it provides a link to the corresponding MCParticle (with an associated index shown). Clicking on the index line allows you to highlight that MCParticle and open its info overlay.
Should I create a table for this case?
MCParticles
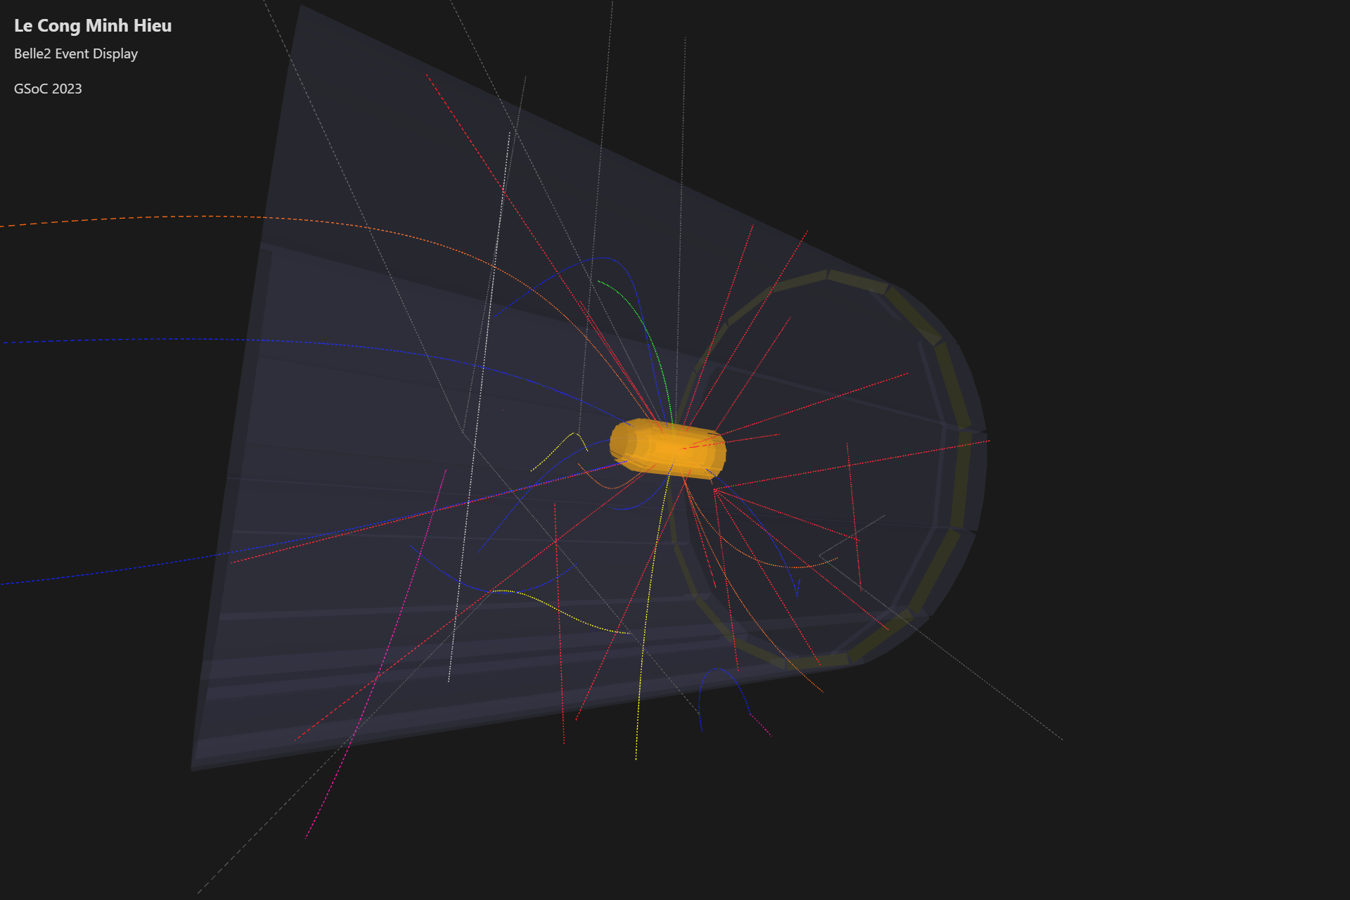
Fig 3. MCParticles
The trajectories of MCParticles are represented as dashed lines, with colors depending on the particle type. The conventional color dependencies for particle types are as follows:
pion: blue
kaon: green
proton: magenta
deuteron: cyan
electron: orange
muon: yellow
photon: red
neutrino: dark grey
neutron, KS, KL, Lambda: light grey
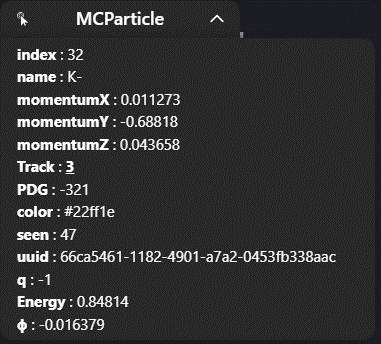
Fig 4. MCParticle Information
MCParticle information includes particle identities (PDG, name), momentums, energy, and charge. It also includes the related Track index; by clicking on it, you can highlight that Track and open its info overlay.
ECLClusters
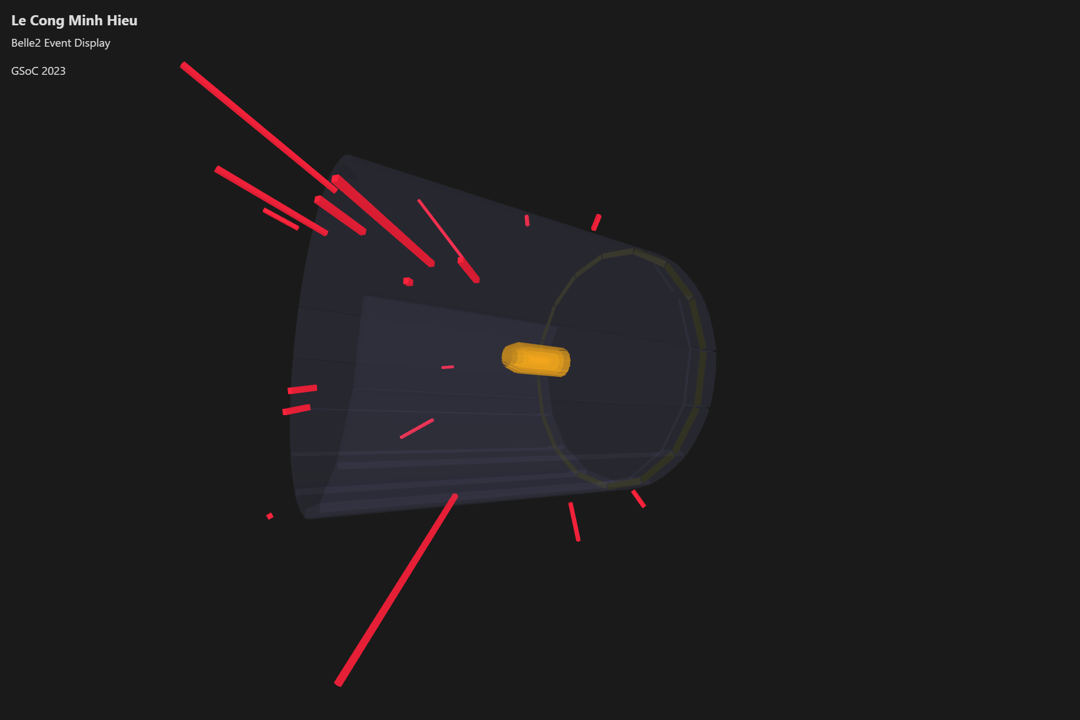
Fig. 5: ECLClusters
ECLClusters are represented as radial red cubes with lengths proportional to their energy.
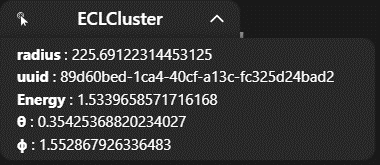
Fig. 6: ECLCluster Information
The info overlay for ECLClusters includes position parameters and energy.
KLMClusters

Fig. 7: KLMClusters
KLMClusters are represented as green cubes arranged in layers.
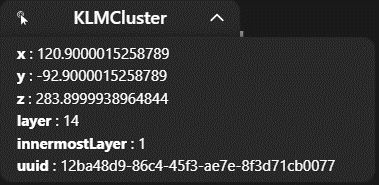
Fig. 8: KLMCluster Information
The info overlay for KLMClusters includes position parameters and the number of layers.